RIRO (версия 1.1)
In these 2 months since a launch of RIRO’s first edition (what is RIRO?) we received a positive feedback confirming the project’s value and public recognition.
In the latest RIRO release (v.1.1.2) you’ll see few important updates:
there’s a new table with the Org IDs used by Russian aggregator eLIBRARY.ru and their sattelite project Russian Science Citation Index (not to be confused with the Clarivate’s product).
all active organizations (at parent level) we added the codes and values for OKOGU - a classificator of the state governing bodies (most of which are the ministires).
a list of organizations was extended up to 2818 active parent orgs.
an official (registration) information for all the organizations was updated in July.
the table with Wikidata records was also updated and revised.
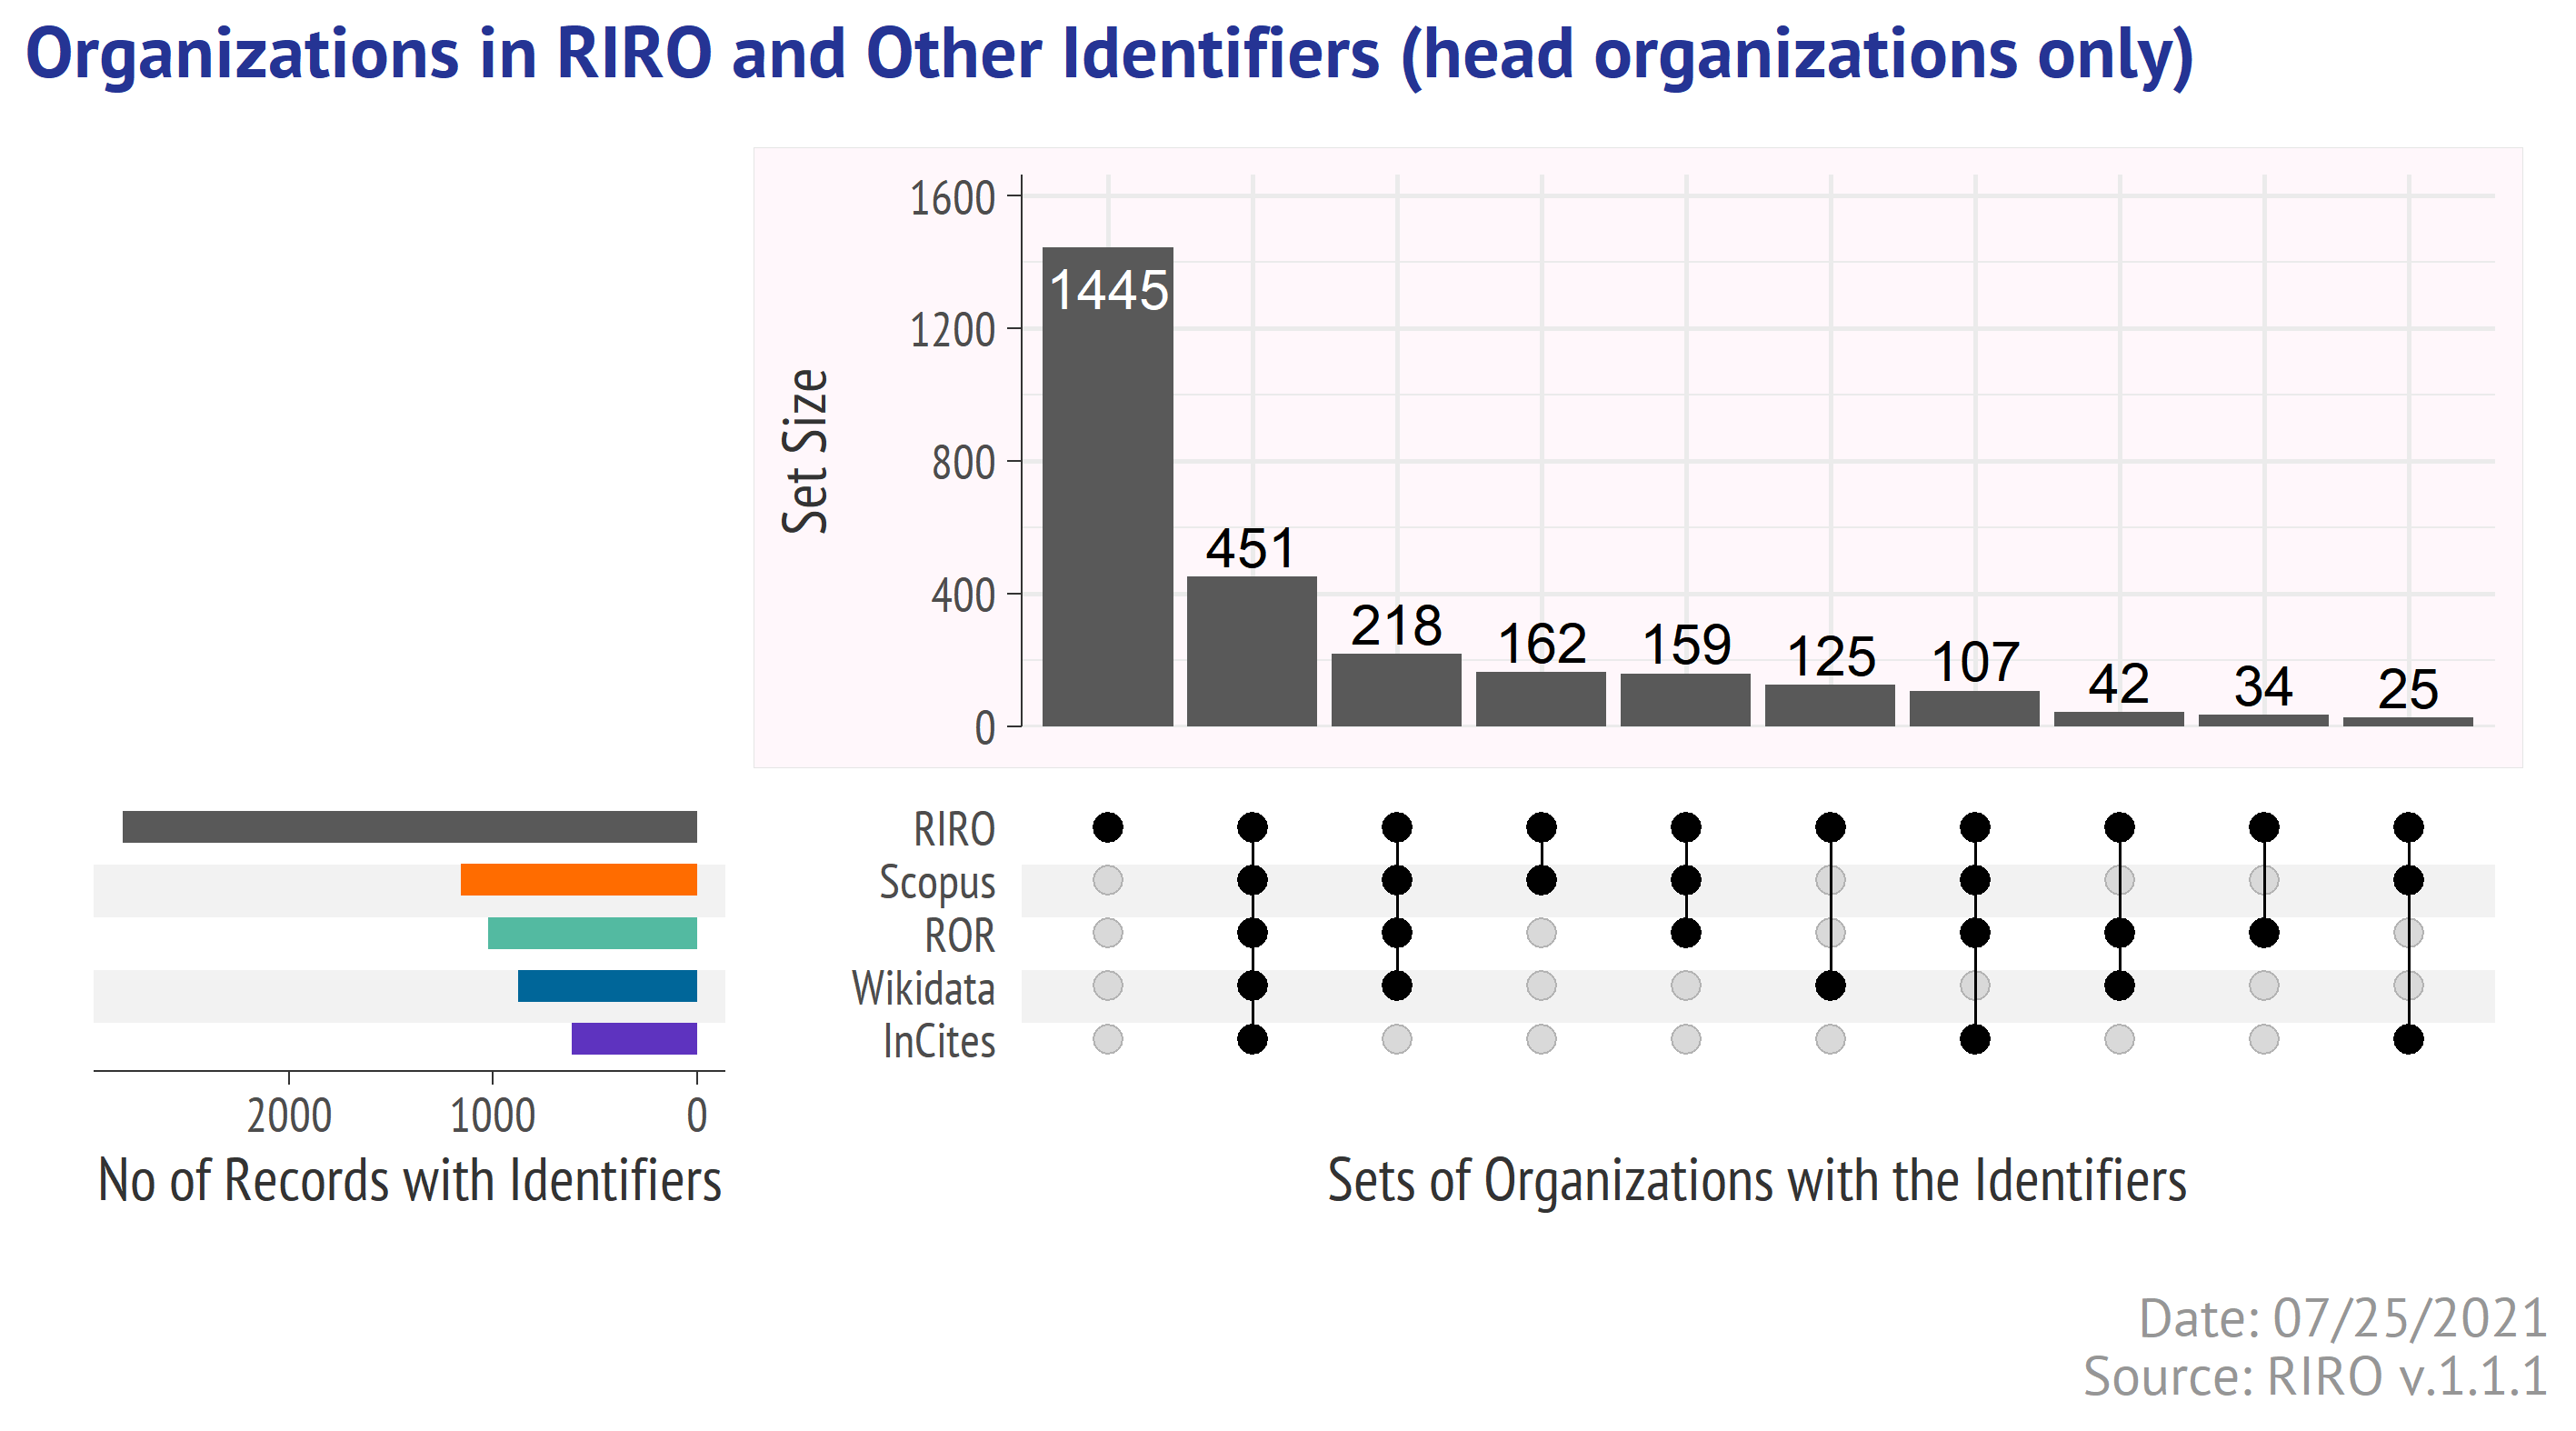
An UpSet diagram below shows the sets of organizations listen in RIRO (v.1.1.2) and matched to the various identifiers. Only the head and active (existing) organizations are counted here, so the identifiers referring to the branches or to the predecessors liquidated via acquisition, are not counted.
Show code
filename <- paste0(img.dir, "chart_upset_v1.1.eng.png")
knitr::include_graphics(filename)
With v.1.1 release RIRO project also gets this website - here we plan to publish not only the RIRO updates, but also the links to research where RIRO was used and the code excerpts. If you utilized RIRO in your study and would like to share your experience with other people, send us a link and we will be happy to place it on the Examples page.
Selection Criteria for Organizations
RIRO is about research, so in general any organization that appear in the affiliations of the scientific articles is a good candidate for RIRO. Participation is free (as in speech). And yet some organizations have been prioritized to appear in RIRO, those are:
state (federal/regonal) organizations doing fundamental or applied research (research centres, scientific institutes, universities, large clinical centers or hospitals, reserves, museums, etc.);
private organizations (mostly universities).
We have not even reviewed the entities associated with the Russian state corporations (RosAtom, RosSpace, RosTech) or the military ones.
Special Notes
RIRO does not copy all the attributes linked to the records in the sources. We selected only the most useful (to our opinion) fields. In future RIRO releases we may add more fields.
The data in the tables 4-11 is the same as in the original sources - we have not changed the original records.
Some tables share the common fields. For example, ROR (table 4) has a column Wikidata, and Wikidata (table 5) has a column ROR. We did not chang or check those links, they are kept as they are present in the original sources, but renamed to avoid confusion (added a prefix referring to the source - ror_wikidata, wd_ror, etc.
Matching the identifiers to the organizations was made based on available information (name, location) - we have not checked if the data asssociated with the identifiers (in the source databases) is correctly assigned to the organizations.
RIRO dataset
All versions of RIRO dataset (CSV tables) can be downloaded from Zenodo community, via OAI-PMH Harvesting API or by using REST API. Zenodo – is one of the leading data repositories supported by CERN (details).
To cite RIRO dataset (without version):
- Sterligov, Ivan, & Lutay, Aleksei. (2021). Russian Index of the Research Organizations (RIRO) [Data set]. Zenodo. https://doi.org/10.5281/zenodo.4775290
To cite the latest version of RIRO (v.1.1.2):
- Sterligov, Ivan, & Lutay, Aleksei. (2021). Russian Index of the Research Organizations (RIRO) (Version 1.1.2) [Data set]. Zenodo. http://doi.org/10.5281/zenodo.5136473
The CSV tables share a primary key named code, so one can easily join the tables or build a database.
Show code
riro_versions <- list.dirs(paste0(dir, "/final_tables/"), recursive =  FALSE) %>%
   sort(., decreasing = TRUE) %>% .[grepl("1.1.1",.)]

riro_tables <- list.files(riro_versions, full.names = TRUE)
Below are the parts of each table corrsponding to the 3 organizations selected as an example:
Siberian Federal University
Perm Federal Research Centre of the Ural branch of the Russian Academy of Sciences
Southern Federal University.
Table 1 - Official Info
This table comprises the basic organization details - OGRN (Primary State Registration Number), INN (Taxpayer Identification Number), KPP (Tax Registration Reason Code), full & short names, status {active, liquidated, in reorganization process}, and the branch type {head or branch}, and also since v.1.1. - OKOGU (the state governing body identificator).
A table below lists the legal entities found by OGRN and their branches (the branch organization and its head entity share same OGRN and INN). To save some space a column with the short names column is not included.
Show code
t1 <- riro_tables %>% .[grepl("table1_",.)] %>%
  read_csv(col_types = cols(.default = col_character()))

test_group <- t1 %>% filter(ogrn %in% c("1025900517378", "1022402137460", "1026103165241"))

test_group %>%
  select(code, level, status, name_full, full_okogu, ogrn, inn, kpp) %>%
datatable(rownames = FALSE, filter = "none", escape = FALSE,
      class = "row-border",
      options = list(columnDefs = list(
              list(width = '600px', targets = c(3)))))
Each row has its unique code whih serves as a primary key for all the tables of the RIRO database.
Table 2 - Locations and Geodata
Table 2 comprises the full address and its separate parts (in Russian), accompanied with the geocode, geo coordinates and time zone. Table 2 is the only table in RIRO having 1:1 correspondance to Table 1 via code. The other tables can have few rows for one code.
Show code
t2 <- riro_tables %>% .[grepl("table2_",.)] %>%
  read_csv(col_types = cols(.default = col_character()))

t2 %>% filter(code %in% test_group$code) %>%
  datatable(rownames = FALSE, filter = "none", escape = FALSE,
            class = "row-border",
            options = list(columnDefs = list(
              list(width = '450px', targets = c(6)))))
Table 3 - Hierarchy
This is a very important table, as it links the parent organizations not only with its current branches, but also with the predecessors (for convenience, in this document both will be referred as “children accounts”).
Table 3 does not pretend to be complete for few reasons:
the list includes only the last predecessors of the current organizations, so there is no historical perspective from 2000s or from USSR.
some organizations have many branch offices (e.g. hospitals), but information about their hierarchy has little or no value from research assessment perspective. Therefore, for some organizations RIRO does not show the branches. The orgs including the branches are mainly the federal organizations (subdued to the ministries and the federal agencies).
The “child_code” is a code for the children account, and the values in the “relation” column reflect nature of the subordination (it can be a branch or a predecessor).
Show code
t3 <- riro_tables %>% .[grepl("table3_",.)] %>%
  read_csv(col_types = cols(.default = col_character()))

full_test <- t3 %>% filter(code %in% test_group$code) %>% arrange(desc(code))
full_test %>% datatable(rownames = FALSE, filter = "none", escape = FALSE, class = "row-border",
            options = list(autoWidth = FALSE,
                           columnDefs = list(list(className = 'dt-center', targets = c(0:2)))))
So, using a list of OGRNs for 3 selected organizations, we extracted from Table 1 18 entities with unique codes (head & branch organizations), further used to retrieve a list of all the predecessors. As a result we get a list of 54 entities with unique code values.
Let’s look into this list:
Show code
hierarchy <- full_test %>%
  add_row(code = unique(full_test$code),
          child_code = unique(full_test$code),
          relation = "Головная") %>%
  rename(parent_code = code, code = child_code) %>%
  arrange(parent_code, relation)

hierarchy %>% count(parent_code, relation) %>%
  pivot_wider(names_from = relation,
              values_from = n, values_fill = 0) %>%
  select(parent_code, parent_org = `Головная`,
           branch = `Филиал`, predecessors = `Правопредшественники`) %>%
  datatable(rownames = FALSE, filter = "none",
            escape = FALSE, class = "row-border",
            options = list(autoWidth = FALSE,
  columnDefs = list(list(className = 'dt-center',
                         targets = c(0:3)))))
One may note that a list of both head and branch organizations can be retrieved from Table 1, so why to use the table 3?
Fair question, let me show you why the RIRO table 3 should not be ignored.
Table 4 - ROR
Research Organizations Registry (ROR) is an international project launched in 2019 with an ambitious goal to create a public ORCID-like registry for the research organizations. It inherits a lot from GRID (Global Research Identifier Database) and Wikidata. The ROR organization info can be downloaded as a JSON dump or retrieved via API.
Table 4 contains not all the Russian-related records from ROR, but only those matched to the organizations present in RIRO.
Show code
t4 <- riro_tables %>% .[grepl("table4_",.)] %>%
  read_csv(col_types = cols(.default = col_character()))

hierarchy %>% inner_join(t4, by = "code") %>%
  arrange(parent_code) %>% select(-parent_code, - relation) %>%
  datatable(rownames = FALSE, filter = "none",
            escape = FALSE, class = "row-border",
            options = list(columnDefs = list(
              list(width = '250px', targets = c(3:5)),
              list(width = '400px', targets = c(8)))))
The column “Relationships” comprise the composite values of following structure:
label:xxxx|type:yyyyyy|id:https://ror.org/zzzzz,
with 3 units (label, type, id) for the relative (according to ROR best judgements) organizations.
In cases like ours such references can be misleading - according to ROR the research institutes of the Perm Federal Research Center have different parents:
label:Department of Energy, Engineering, Mechanics and Control Processes|type:Parent|id:https://ror.org/05kknxr83
label:Department of Biological Sciences|type:Parent|id:https://ror.org/038rjvd86
label:Ural Branch of the Russian Academy of Sciences|type:Parent|id:https://ror.org/02s4h3z39
label:Department of Chemistry and Material Sciences|type:Parent|id:https://ror.org/059tqvg48
So for a single organization ROR shows 4 accounts subordinating to 4 different RAS structures (which is a total confusion, of course).
The truth is that the found 4 research institutes of the Perm Federal Research Center ceased to exist as individual legal entities few years ago, they were acquired by the newly formed federal centre and are now its branches.
That’s the value of Table 3 in RIRO - it helps to gather the related identifiers and qualify them as corresponding to a branch or a predecessor.
Table 5 - Wikidata
WikiData is a public repository of structured data originating from multiple sources. Some sources are more or less consistent (like CrossRef or ISSN), but there’s also a lot of Wikidata records that are created and modified by people. As a result, even though Wikidata offers a pre-defined templates for the profiles of universities and research organizations, many profiles have unpopulated fields.
The table 5 comprises just a part of fields present in the Wikidata organization items and it lists only those Russian research organizations that we matched against the RIRO organizations.
Show code
t5 <- riro_tables %>% .[grepl("table5_",.)] %>%
  read_csv(col_types = cols(.default = col_character()))

hierarchy %>% inner_join(t5, by = "code") %>%
  arrange(parent_code) %>%
  select(-parent_code, - relation, -wd_item) %>%
  mutate_at(c("wikipedia_eng", "wikipedia_rus", "wd_altlabel_eng", "wd_altlabel_rus"),
            ~ifelse(is.na(.x),.x, paste0(substr(.x,1,40),"...")))%>%
  datatable(rownames = FALSE, filter = "none", escape = FALSE, class = "row-border",
            options = list(columnDefs = list(
              list(width = '250px', targets = c(2:4)),
              list(width = '150px', targets = c(6:9)))))
Table 6 - Scopus
Scopus is a (one of leading) citation index accumulating the metadata from 20k+ journal titles, selected conference sources, and some academic book titles. Table 6 lists the Scopus affiliation profiles matched to the organizations in RIRO, and also a number of publications under Scopus affiliation profile (on a data of request, April 2021).
Over 1000 Russian research organizations (and universities) have an access to Scopus under the state-funded centralized subscription, and can use the matched IDs via the online UI or the API-service. The latter has few wrappers for python and R that make working with API more comfortable.
Please note that matching the affiliation profiles to RIRO organizations is based on the affiliation name and city. It does not guarantee that all the publications in the profile are assigned to it correctly. More details on how to edit the affiliation profiles in Scopus can be found on Elsevier web site.
Show code
t6 <- riro_tables %>% .[grepl("table6_",.)] %>%
  read_csv(col_types = cols(.default = col_character()))

hierarchy %>% inner_join(t6, by = "code") %>%
  arrange(parent_code) %>% select(-parent_code, - relation) %>%
  datatable(rownames = FALSE, filter = "none", escape = FALSE, class = "row-border",
            options = list(columnDefs = list(
              list(className = 'dt-center', targets = c(0,6)),
              list(width = '350px', targets = c(2:3)))))
Table 7 - Microsoft Academic
Microsoft Academic Graph (MAG) is a database created based on the information extracted with Bing-parsers from the publisher web sites and PDF files details). This approach is differen from the one utilized by Web of Science and Scopus that receive a large part of information for indexation directly from the publishers.
MAG is also a source of information for many novel solutions like Lens, Semantic Scholar, Open Academic Graph, Unsub.
Even though the last news about MAG shocked us too, we decided to include the MAG Organization IDs into RIRO. Few international companies committed to launching a new tool that may substitute MAG:
ANNOUNCING: We’re building a replacement for Microsoft Academic Graph. https://t.co/GXelkpt6Zc
— Our Research (@our_research) May 8, 2021
Thanks to @MSFTResearch for providing the Microsoft Academic Graph (MAG). We’ve been working with MSR and MAG since 2018, and we’ve been collaborating on this transition for some time. 1/3https://t.co/7aHTLio8uK
— Semantic Scholar (@SemanticScholar) May 11, 2021
Table 7 lists just the MAG organization IDs and names agains the RIRO codes.
Show code
t7 <- riro_tables %>% .[grepl("table7_",.)] %>%
  read_csv(col_types = cols(.default = col_character()))

hierarchy %>% inner_join(t7, by = "code") %>%
  arrange(parent_code) %>% select(-parent_code, - relation) %>%
  datatable(rownames = FALSE, filter = "none", escape = FALSE, class = "row-border",
            options = list(autoWidth = FALSE,
              columnDefs = list(
                list(className = 'dt-center', targets = c(0:1)),
                list(width = '450px', targets = c(2)))))
Table 8 - InCites
InCites is an analytical solution build over Web of Science Core Collection. It allows to export the records, so the matched names can be used for further analysis.
The table 8 lists the official organization names in InCite and Web of Science Core Collection against the RIRO codes.
Show code
t8 <- riro_tables %>% .[grepl("table8_",.)] %>%
  read_csv(col_types = cols(.default = col_character()))

hierarchy %>% inner_join(t8, by = "code") %>%
  arrange(parent_code) %>% select(-parent_code, - relation) %>%
  datatable(rownames = FALSE, filter = "none", escape = FALSE, class = "row-border",
            options = list(autoWidth = FALSE,
              columnDefs = list(
                list(className = 'dt-center', targets = c(0,3)),
                list(width = '450px', targets = c(1:2)))))
Table 9 - SciVal
SciVal is an analytical tool build over Scopus. Some Russian organizations have an access to SciVal API and could use the IDs matched against the RIRO codes in the table 9.
Show code
t9 <- riro_tables %>% .[grepl("table9_",.)] %>%
  read_csv(col_types = cols(.default = col_character()))

hierarchy %>% inner_join(t9, by = "code") %>%
  arrange(parent_code) %>% select(-parent_code, - relation) %>%
  datatable(rownames = FALSE, filter = "none", escape = FALSE, class = "row-border",
            options = list(autoWidth = FALSE,
              columnDefs = list(
                list(className = 'dt-center', targets = c(0:1)),
                list(width = '450px', targets = c(2)))))
Table 10 - Russian Universities Assessment System (by the Ministry of Science & Higher Education)
The system gathers the university statistical reports from all Russian higher education institutions (except some schools under the Ministries of Defence, etc). The reports contain a lot of useful information - from financial to enrollment data.
Table 10 lists the IDs that corresponds to the university’s web page on the portal, matched to the RIRO codes.
Show code
t10 <- riro_tables %>% .[grepl("table10_",.)] %>%
  read_csv(col_types = cols(.default = col_character()))

hierarchy %>% inner_join(t10, by = "code") %>%
  arrange(parent_code) %>% select(-parent_code, - relation) %>%
  datatable(rownames = FALSE, filter = "none", escape = FALSE, class = "row-border",
            options = list(autoWidth = FALSE,
              columnDefs = list(list(className = 'dt-center',
                                     targets = c(0:1)))))
Table 11 - Web of Science
Web of Science is by far the world’s oldest and most prominent citation index. At this moment Web of Science does not provide the organization IDs that could be used for search or data retrieval, but the search results have the orgaization names. The table 11 lists almost 4000 such names matched to the organizations in RIRO. This is not a complete list of known affiliation names for the Russian research organizations, but we hope to adjust this table in future releases of RIRO.
Show code
t11 <- riro_tables %>% .[grepl("table11_",.)] %>%
  read_csv(col_types = cols(.default = col_character()))

hierarchy %>% inner_join(t11, by = "code") %>%
  arrange(parent_code) %>% select(-parent_code, - relation) %>%
  datatable(rownames = FALSE, filter = "none",
            escape = FALSE, class = "row-border",
            options = list(autoWidth = FALSE,
              columnDefs = list(
                list(className = 'dt-center', targets = c(0)),
                list(width = '450px', targets = c(1,3)))))
Table 12. eLIRBARY.ru
eLIBRARY.ru is the largest Russian aggregator of the scholarly contents. In the last years the company actively invests into the online services, including API. The Org ID is used in the URLs of the organization profiles (e.g. https://www.elibrary.ru/org_about.asp?orgsid=17548) and by some API.
Table 12 lists the organization ids of 1827 largest Russian research organizations. We cooperate with the proprietor to extend the list in the next RIRO releases.
Show code
t12 <- riro_tables %>% .[grepl("table12_",.)] %>%
  read_csv(col_types = cols(.default = col_character()))

hierarchy %>% inner_join(t12, by = "code") %>%
  arrange(parent_code) %>% select(-parent_code, - relation) %>%
  datatable(rownames = FALSE, filter = "none",
            escape = FALSE, class = "row-border",
            options = list(autoWidth = FALSE,
              columnDefs = list(
                list(className = 'dt-center', targets = c(0,1)),
                list(width = '450px', targets = c(2)))))
All IDs for 3 organizations
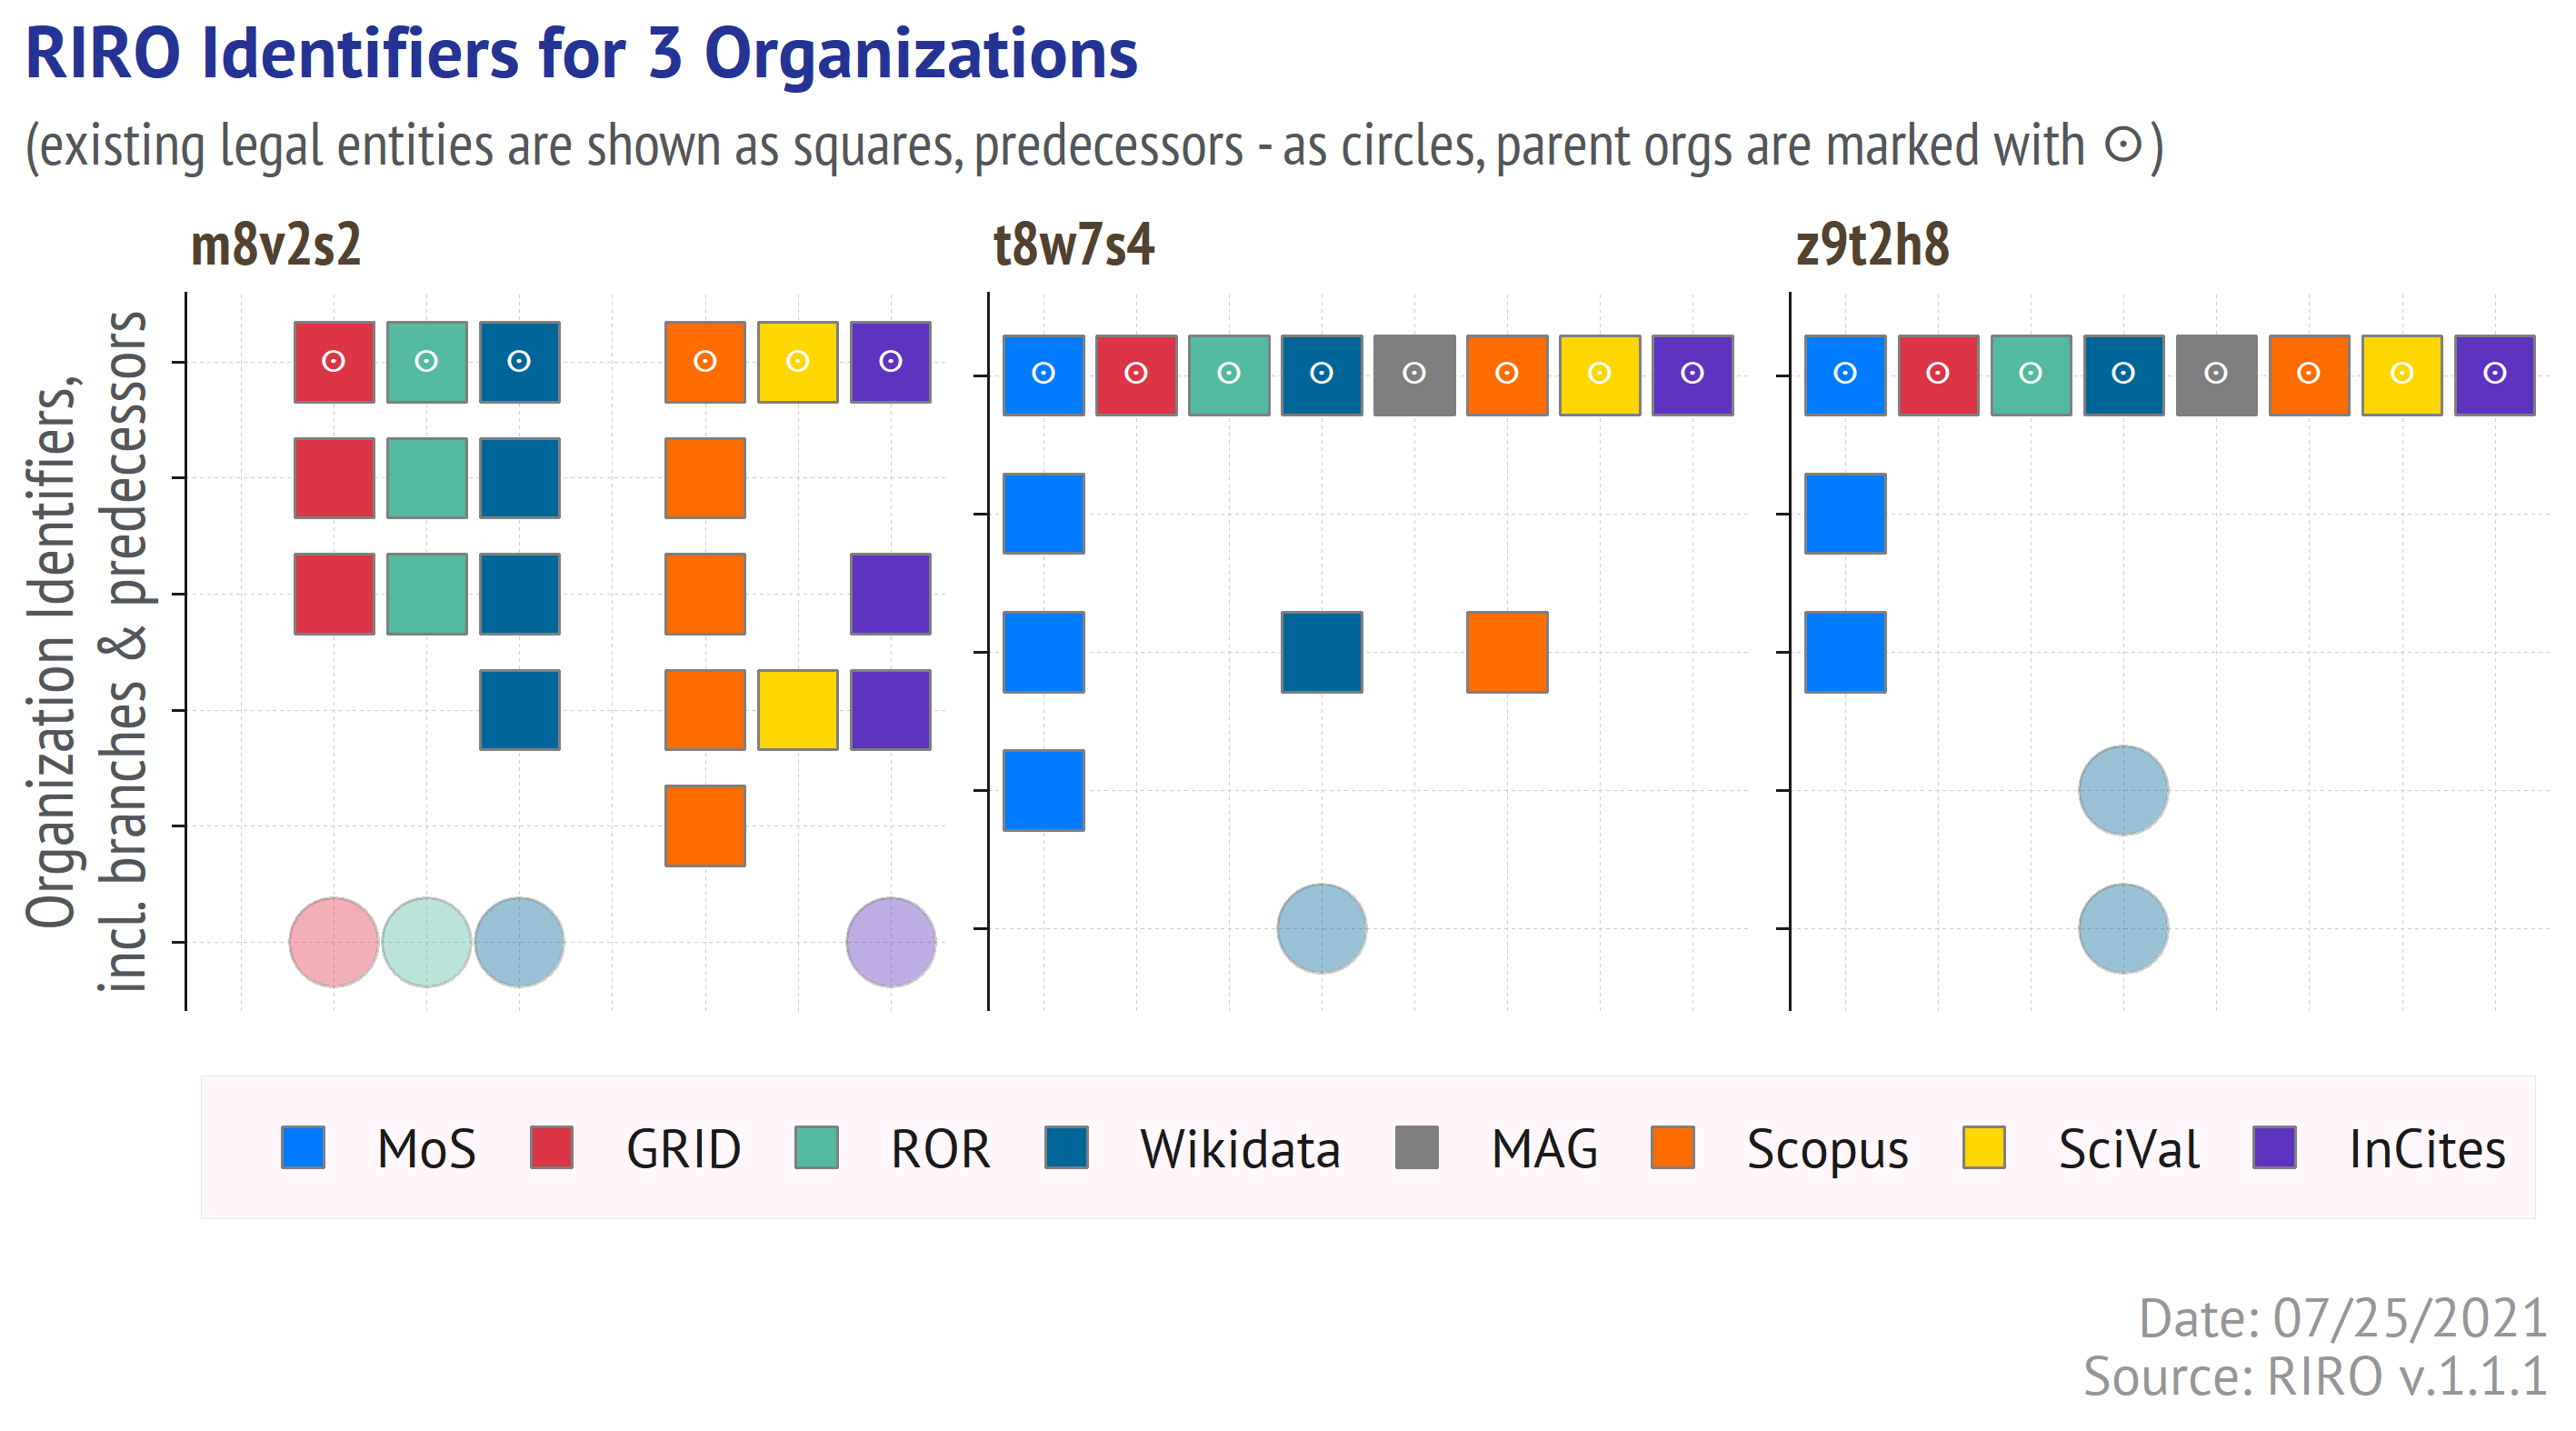
An illustration below shows the identifiers (ROR, GRID, Scopus Affiliation ID, InCites ID, MAG, Wikidata) matched to 3 organizations selected as an example. Some IDs correspond to the head organizations, the others either to the branches or to the predecessors.
The identifiers are placed along X-axis, organized in three sections (by organization). The RIRO entities are place along Y-axis, the existing organization are shown as squares (the head organizations are also marked with a special sign), the predecessors as circles.
Show code
filename <- paste0(img.dir, "chart_examples_v1.1_eng.png")
knitr::include_graphics(filename)
Feedback
For RIRO v.1.1 we have a google form (in Russian) with the following scenarios of the change requests:
- update the official organization data
- add new organization absent in RIRO
- change a link between the identifier & organization in tables 4-12 (ROR, GRID, Wikidata, etc)
- add new links, missing in the tables 4-12
- suggest a new data source & identifiers).
We do hope that feedback will help us to make RIRO a more valuable tool.
Acknowledgments
Allaire J, Xie Y, McPherson J, Luraschi J, Ushey K, Atkins A, Wickham H, Cheng J, Chang W, Iannone R (2021). rmarkdown: Dynamic Documents for R. R package version 2.7, <URL: https://github.com/rstudio/rmarkdown>.
Blondel E (2021). zen4R: Interface to ‘Zenodo’ REST API. R package version 0.4-3, <URL: https://github.com/eblondel/zen4R>.
Chang, W (2014). extrafont: Tools for using fonts. R package version 0.17, <URL: https://CRAN.R-project.org/package=extrafont>.
Henry L, Wickham H (2020). purrr: Functional Programming Tools. R package version 0.3.4, <URL: https://CRAN.R-project.org/package=purrr>.
Krassowski M (2020). “ComplexUpset.” doi: 10.5281/zenodo.3700590 (URL: https://doi.org/10.5281/zenodo.3700590), <URL: https://doi.org/10.5281/zenodo.3700590>.
Lex A, Gehlenborg N, Strobelt H, Vuillemot R, Pfister H (2014). “UpSet: Visualization of Intersecting Sets,.” IEEE Transactions on Visualization and Computer Graphics, 20(12), 1983–1992. doi: 10.1109/TVCG.2014.2346248 (URL: https://doi.org/10.1109/TVCG.2014.2346248), <URL: https://doi.org/10.1109/TVCG.2014.2346248>.
Wickham H (2020). tidyr: Tidy Messy Data. R package version 1.1.2, <URL: https://CRAN.R-project.org/package=tidyr>.
Wickham H (2016). ggplot2: Elegant Graphics for Data Analysis. Springer-Verlag New York. ISBN 978-3-319-24277-4, <URL: https://ggplot2.tidyverse.org>.
Wickham H (2019). stringr: Simple, Consistent Wrappers for Common String Operations. R package version 1.4.0, <URL: https://CRAN.R-project.org/package=stringr>.
Wickham H, Francois R, Henry L, Muller K (2021). dplyr: A Grammar of Data Manipulation. R package version 1.0.3, <URL: https://CRAN.R-project.org/package=dplyr>.
Wickham H, Hester J (2020). readr: Read Rectangular Text Data. R package version 1.4.0, <URL: https://CRAN.R-project.org/package=readr>.
Wickham H, Seidel D (2020). scales: Scale Functions for Visualization. R package version 1.1.1, <URL: https://CRAN.R-project.org/package=scales>.
Xie Y (2020). knitr: A General-Purpose Package for Dynamic Report Generation in R. R package version 1.30, <URL: https://yihui.org/knitr/>.
Xie Y (2015). Dynamic Documents with R and knitr, 2nd edition. Chapman and Hall/CRC, Boca Raton, Florida. ISBN 978-1498716963, <URL: https://yihui.org/knitr/>.
Xie Y (2014). “knitr: A Comprehensive Tool for Reproducible Research in R.” In Stodden V, Leisch F, Peng RD (eds.), Implementing Reproducible Computational Research. Chapman and Hall/CRC. ISBN 978-1466561595, <URL: http://www.crcpress.com/product/isbn/9781466561595>.
Xie Y, Allaire J, Grolemund G (2018). R Markdown: The Definitive Guide. Chapman and Hall/CRC, Boca Raton, Florida. ISBN 9781138359338, <URL: https://bookdown.org/yihui/rmarkdown>.
Xie Y, Cheng J, Tan X (2021). DT: A Wrapper of the JavaScript Library ‘DataTables’. R package version 0.17, <URL: https://CRAN.R-project.org/package=DT>.
Xie Y, Dervieux C, Riederer E (2020). R Markdown Cookbook. Chapman and Hall/CRC, Boca Raton, Florida. ISBN 9780367563837, <URL: https://bookdown.org/yihui/rmarkdown-cookbook>.